Aug 2024
Modeling Asset Risk Using EPSS
How can we best operationalize EPSS in our environment by utilizing its mathematical properties?

Author’s note: I often use the word exploited and the phrase exploitation activity interchangeably. To be clear, the EPSS model’s data sources provide observed CVE exploitation activity, which means that it doesn’t necessarily have to be successful. When you see these words and phrases, remember this note.
In my time running an enterprise vulnerability management program while serving as the EPSS SIG co-chair, I’ve been fortunate enough to bounce ideas off of some of the smartest people in the world.
One of those ideas is the framing of how to best operationalize EPSS scores in a vulnerability management program while taking advantage of its mathematical properties.
The EPSS user guide hosted on FIRST contains a section titled “3: EPSS Can Scale, to Produce System, Network, and Enterprise-level Exploit Predictions.” In this section, the “at least one” property of probability is covered and applied to EPSS that allows it to scale to any sort of data slice or grouping that the operator wishes. For example, you can calculate the EPSS score of an asset, an entire subnet, network, or enterprise.
This capability is possible because of a statistical property about the independence of events, and requires simply computing the probability of at least one event occurring.
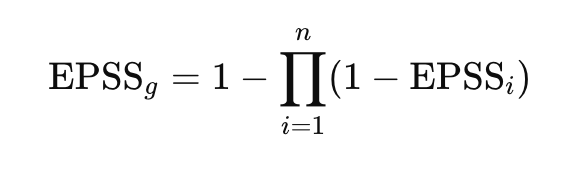
To formalize this property applied to EPSS, I propose for it to be formally defined as EPSSg (pronounced EPSS sub g, or Grouped EPSS).
EPSSg
With EPSS, we can perform this calculation for slices of our vulnerability data, such as grouping by asset. Essentially we are saying, given the CVEs detected on this asset, what is the probability that at least 1 of those CVEs will have observed exploitation activity in the next 30 days?
We calculate this by calculating the probability that the CVE will not be exploited (1-EPSS) and taking the product of all of these values for the grouping we are using: Π(1-EPSSᵢ) for i EPSS scores of n CVEs.
The result is the probability that no CVEs will be exploited on this asset. To calculate the probability of at least 1, we just subtract this number from 1.
Here is the formula expression:
Here is some example python code that performs this calculation:
import pandas as pd
from datetime import date
#Assuming columns asset_id, cve for my_asset_cves.csv
df = pd.merge(pd.read_csv('my_asset_cves.csv'),
              pd.read_csv(f'https://epss.cyentia.com/epss_scores-{date.today()}.csv.gz',
                          comment='#', compression='gzip'),
              on='cve',
              how='left')
asset_epssg = df.groupby('asset_id')['epss'].apply(lambda x: 1 - (1 - x).prod())
Visualizing the Distribution of Asset EPSSg
Now that we have formalized the definition and can calculate this value for all of our assets, we want to take a peak at what our current posture looks like. In order to do that, we can leverage some plotting libraries to create a histogram, such as the one below.
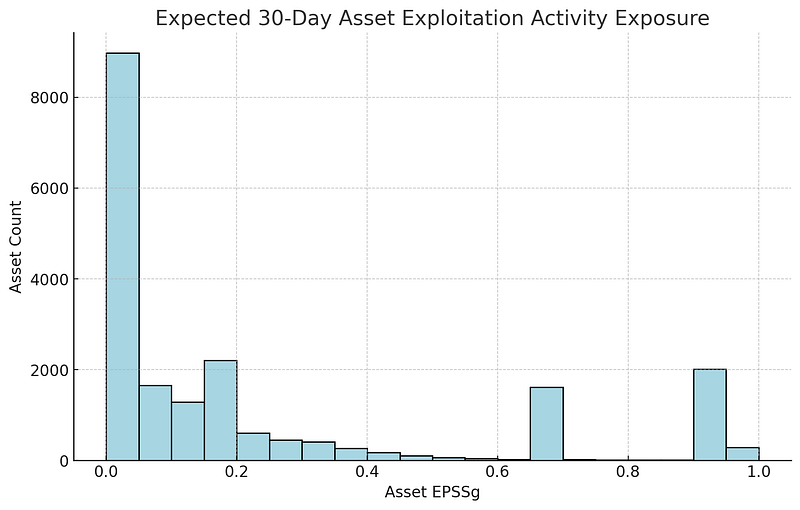
What we can see here in our sample data is that most of our assets fall within the 0–0.05 bin, but beyond that, we have some peaks and valleys up to the .95–1.0 bin.
What does this tell us?
We see little exploitation exposure risk with a majority of our assets, but there are a few concerning bins where we should zoom in and focus our attention. Granted, this is looking only at the likelihood portion of risk, so let’s fix that if we can.
Overlaying Asset Attributes
Depending on what is important to your organization, and your capability to assign asset attributes, at the very least you can overlay qualitative asset labels (that represent potential impact) with your Asset EPSSg distribution to get a sense of where the problem areas are.
For instance, if you have the capability to know what types of data each asset has access to, or have business logic codified to assign how important each asset is to the business, you can overlay those values onto this distribution. This can help visualize the current risk posture, as well as track the changes to that posture over time.
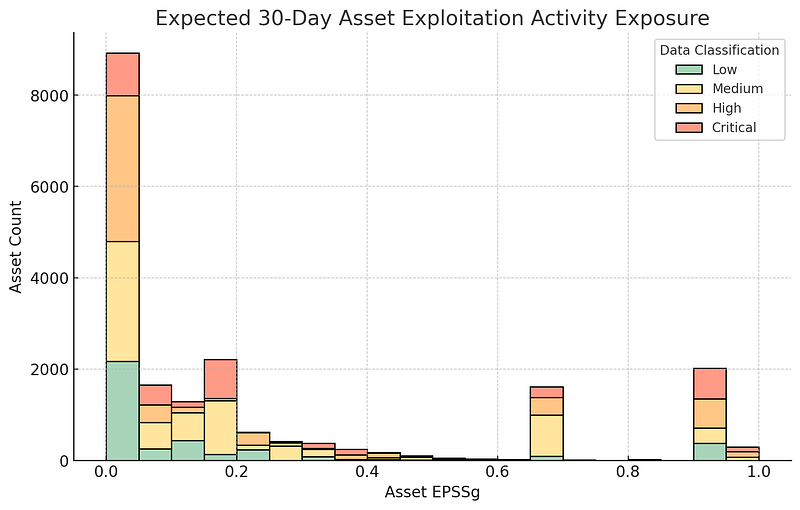
In this example, I’ve overlayed a random distribution of data classification labels. Again, your mileage may vary here, but this visual can give you a sense of where to focus your efforts.
How can EPSSg inform remediation strategy?
You can see in the above distribution that we likely want to focus on the Critical and High data classification assets closest to 1.00. Essentially, we want to reduce our bucketed asset counts on the right, and increase them on the left to show risk reduction.
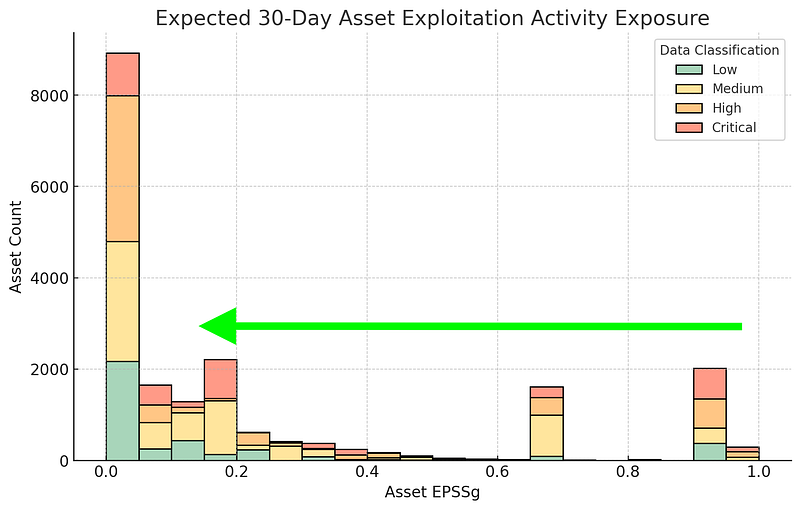
To do this, we can look at the highest EPSS scores for CVEs on those assets, but we also want to know which ones are low effort to move the needle and which ones will require additional effort to reduce risk.
ΔEPSSg
One way of figuring that out is by calculating the projected EPSSg score for each asset if a CVE is removed (patched, mitigated, etc.). For each asset, we know that fixing the highest EPSS-scoring CVE will be the most impactful for the overall EPSSg score of that asset, but what we’re really after is which assets can we easily move the needle on. In order to do that, we can compare the ΔEPSSg score of each instance of a CVE.
Below is how to calculate ΔEPSSg.

The higher the ΔEPSSg score, the more impactful the removal of that single CVE is to the organization’s asset risk posture.
Over time, continuously calculating and plotting this data will show you if your strategy is effective, or if it needs tweaking. This is good, as it provides the feedback loop any model needs to be successful.
Future Work
Using these calculations as a basis for our risk posture, which I like to call a Risk Quant/Qual Hybrid Approach (I’m still workshopping that 😉), we have the potential to unlock more insights into our organization’s CVE risk posture.
Looking back at the EPSS user guide section titled “3: EPSS Can Scale, to Produce System, Network, and Enterprise-level Exploit Predictions,” we can of course apply the same logic presented here for other slices of data.
In addition, though likely compute heavy, we can calculate ΔEPSSg for more than 1 CVE and get an idea of what the impact of removing specific groups of CVEs will have on EPSSg.
Closing Thoughts
All of this being said, EPSS is a moving target. The scores change daily, so in order for your organization’s model to keep pace, these calculations also have to be run daily. However, I’d argue this isn’t a requirement to stand up these calculations yourself. Start small, and iterate to where you/your organization is comfortable from a cost/effort perspective.
The ultimate goal here is to formulate an overall Vulnerability (CVE) Management strategy specific to your organization to target risk reduction instead of chasing CVEs. CVE issuance isn’t slowing down, and evaluating each of them easily outpaces not only your organization, but NVD analysts as well.
It’s time to approach this vertical more quantitatively.
Focus on what matters.
Have more questions about EPSS ? Check out the FAQ here, or join the EPSS Special Interest Group (SIG) to engage directly with the chairs and other vulnerability management enthusiasts.
The views presented in this blog are entirely my own and do not represent the views of any organization or other affiliation.
Bonus Thoughts!
Minority Report
But Stephen, what if I have to use some variation of CVSS or have other qualitative attributes of CVEs that I need to prioritize over the output of this model?
My response? Go for it. EPSS and EPSSg are models of likelihood and should never be used in a vacuum.
When I speak about this, I come back to the analogy of a minority report from the novella The Minority Report by Philip K. Dick, or the better known 2002 film Minority Report starring Tom Cruise.
From the film, minority reports are essentially a different version of the future that is possible, but coming from a minority of the precogs that envisioned them.
In our context, we can think of a minority report as an outcome that is just as valid as the majority report of a model, because a model is just trying to measure the state of reality. If we have constraints on how the model needs to operate, utilizing feedback loops are a good way to update our model with these constraints/beliefs.