Nov 2023
Determining EPSS Score Thresholds for Prioritization
Just tell me which score to use!
As I observe the adoption and rhetoric around the Exploit Prediction Scoring System (EPSS), two themes that I see recurring are:
- An unfamiliarity with what EPSS actually is; and
- Unclear guidance on how to determine score thresholds for prioritization.
The last bit is an intentional omission by the co-chairs, as it is not a problem that the model is designed to solve, nor do the co-chairs recommend the usage of “binning” without a clear understanding that the practice could result in information loss.
However, industry adoption of EPSS may suffer if there is not at least some guidance on how to integrate it into existing vulnerability scoring or prioritization methodologies, including when to start caring about the score and/or percentile (hint: you should always care). Of course, organizations and vendors are welcome to decide on their thresholds for prioritization/categorization based on their risk tolerance or scoring system. Still, in practice, this may be even harder to determine than the exercise I’m about to perform here. I’ve seen entities vary widely in how they bin EPSS scores (with some even treating them as a severity score).
Quick Primer on EPSS
EPSS is a machine learning model that outputs a probability of exploitation in the next 30 days for each vulnerability assigned a Common Vulnerabilities and Exposures (CVE) identifier.
Full stop.
Let’s break that down.
(1) It’s a machine-learning model. What does that mean?
If you’re unfamiliar with machine learning (ML), one way that helped me understand it at a high level was to liken its principles to weather forecasts (its use in meteorology is surprisingly very recent).
- Training the Forecaster: First, we train our weather forecasting model by showing it lots of past data about various weather patterns and their evolution. This helps the forecaster learn how to recognize the signs of an upcoming storm.
- Testing the Forecaster: To see how good our weather forecasting model has become, we give it new data from a specific day — let’s say today. We then ask it to predict the weather over the next week. This gives it a chance to forecast the weather for the next week based on today’s conditions and attributes.
- Improving Predictions: At the beginning, our weather forecasting model might not be very good at predicting the weather. We can continue to adjust its methods by looking for a different combination of attributes in its dataset to use, incorporating new datasets, or making different decisions to reach the desired performance.
If we substitute weather for exploitation activity, that’s the EPSS model. It’s trained on past vulnerability exploitation activity, and the patterns discovered among various CVE attributes.
(2) It outputs a probability. What does that mean?
Probability is the likelihood of an event occurring.
In our weather forecast analogy, we would be outputting a probability that the weather we predicted would occur based on the relationships of attributes the model has discovered.
In EPSS, the model is outputting a probability that CVE exploitation activity will appear in its data sources in the next 30 days (The caveat here is that EPSS is only trained on certain exploit activity based on intrusion detection systems from its data partners). It specifically is measuring the threat aspect of risk, in contrast to CVSS, which measures the severity aspect.
Okay, so how do I know it’s any good, and how do I use it?
A way to measure the performance of this type of ML model is to look at something called the Precision/Recall Curve and the F1 score.
To level-set, precision measures the ratio of true positives to all positive results predicted by the model (true positives + false positives). Recall, on the other hand, is the measure of how many true positives the model has found out of all the possible positives (true positives plus false negatives).
The Precision/Recall Curve plots the values of precision and recall at various probability thresholds. The area under this curve is often used as a metric to measure the performance for rare binary events, which aligns with EPSS (predicting the rare event of exploitation activity given all CVEs), but since I’m not a data scientist, we won’t delve too much into that here.
The F1 score of an ML model is the harmonic mean of precision (efficiency) and recall (coverage) on the Precision/Recall Curve. It is a balanced measure that weights precision and recall equally. The highest possible value for an F1 score is 1.0, indicating perfect precision and recall.
The formula for the F1 score is:

The EPSS v3 paper provides efficiency and coverage analysis for the model’s performance. The F1 value for the model is .728, which would translate to an EPSS score of 36%. For context, the F1 scores for EPSS v2 and EPSS v1 prioritize vulnerabilities with an exploitation probability of 16% and 20%, respectively. The F1 score for CVSS v3.x base scores prioritizes vulnerabilities with a base score of 9.7 and up. The actual F1 scores, AUC-PRs, and precision and efficiency numbers can be found in section 5.2 of the EPSS v3 paper.
The authors even propose a potential prioritization strategy in the paper utilizing this threshold. So let’s start there.
36%
If we weigh precision and recall equally, is 36% a good initial threshold to start prioritizing CVEs? If this threshold were used, only 3.5% of all published vulnerabilities would need to be prioritized for remediation (which is close to the EPSS v1 rate of exploitation in its dataset of 3.7%). Of course, this will vary from organization to organization due to differing technologies in use and how many garbage CVEs get published, but regardless, the distribution of CVEs above this threshold should be small.
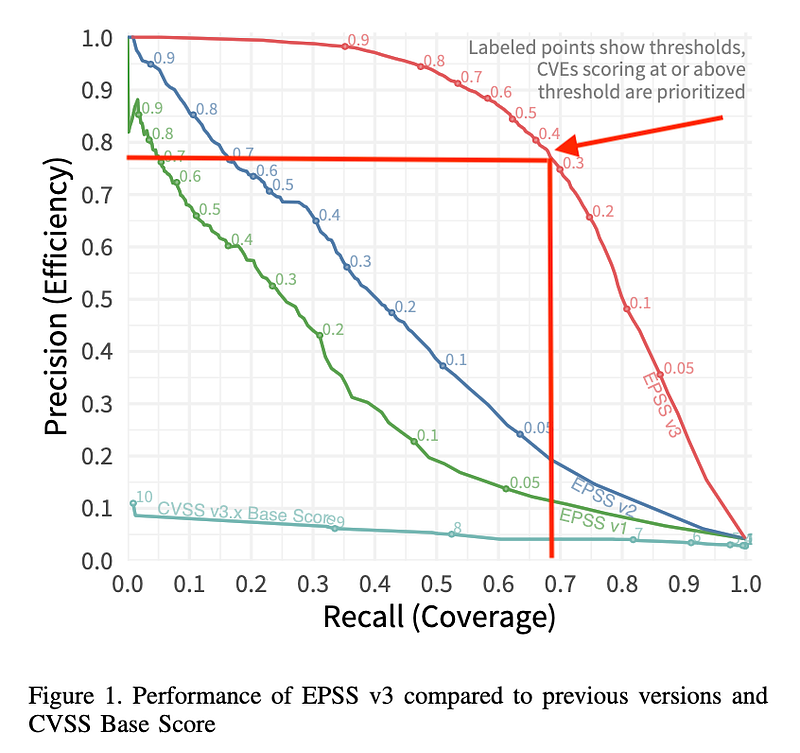
Since 36% is equivalent to the F1 score of the model, we can conclude that this score is the optimal prioritization threshold that will both reduce false positives and false negatives and increase the rate of true positives and true negatives for new vulnerabilities scored via the model. However, weighting these two measures equally may not be ideal for some larger organizations that can afford to spend more resources on increasing recall.
In addition, EPSS v1 produced a 37.1% overall exploitation probability when a vulnerability is weaponized (meaning that exploit code is loaded into an offensive tool such as Metasploit), which is a 10-fold increase in the likelihood of exploitation activity (the EPSS v1 dataset had a 3.7% rate of observed exploitation of the vulnerabilities used to build it). EPSS v3 continues to confirm that “published exploit code is the strongest contributor to the estimated probability of exploitation activity.” We can thus infer that at the 36% threshold, we are prioritizing CVEs that likely have public exploit code in a weaponized format or have similar attributes to those that do, and we are optimizing for both prioritization efficiency and exploitation activity coverage.
10%
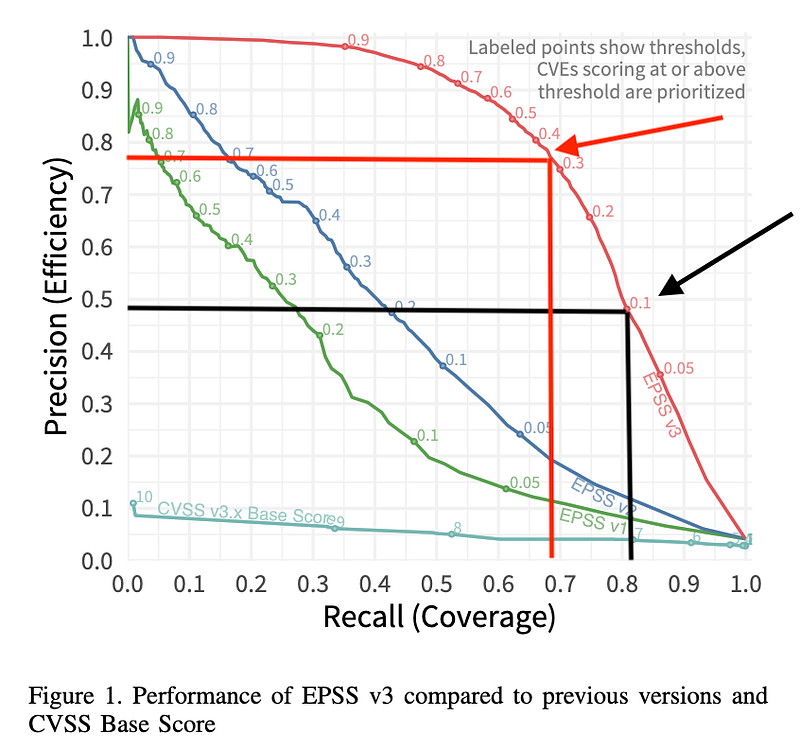
If we move our threshold down to say 10%, we would be increasing both False Positives and True Positives giving us more coverage, but at the cost of efficiency. Chris Madden makes a compelling case to use this threshold, in that when compared to CISA KEV, only about half of the CVEs have a score above 10% as shown in his slide below.
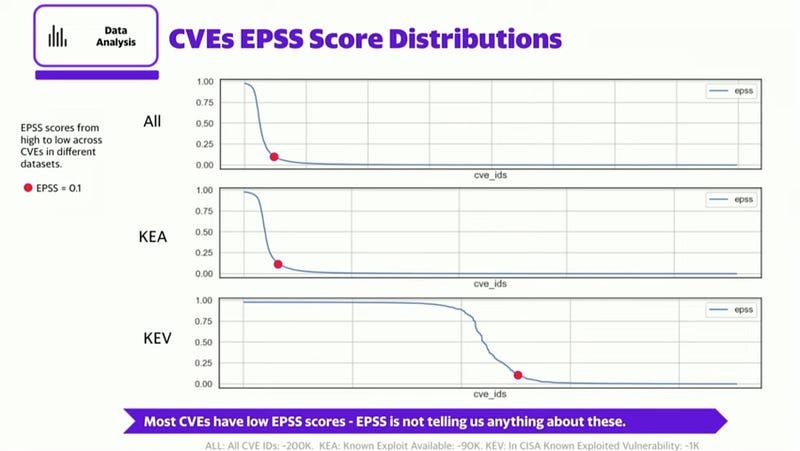
This essentially communicates that lower EPSS scores (under 10%) do not necessarily mean a low probability of exploitation, but since the data and methods used to curate the KEV catalog, and the data used to generate the EPSS model are both opaque to the public, I don’t necessarily have high confidence in that implied message.
Below, you can see the efficiency cost when lowering our threshold to 10%.
Further down the scale
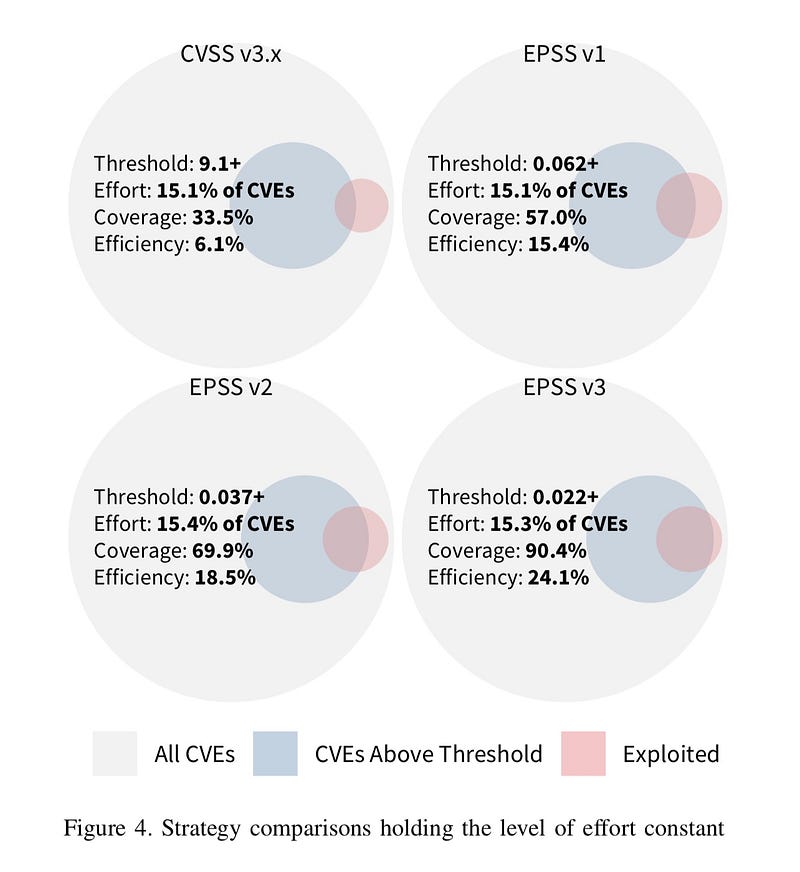
If we continue to decrease our threshold to something like 2.2% as depicted in the figure above for the EPSS v3 model, we would be prioritizing ~90% of CVEs with observed exploit activity, but at the cost of efficiency. Essentially, we would be wasting effort on CVEs that will never have exploit activity associated with them. This is certainly a valid strategy as long as the program and overall organization has the capacity to take on the extra remediation activities, but that may not be true for every organization, especially smaller ones.
Capacity-Based
If you’re able to measure the capacity that your system owners have to remediate or mitigate vulnerabilities, you may be able to tune the threshold to correlate with it. Say for instance you start at 36% but want to move to 10%. Does that just happen? Do we want to measure how we’re doing with 36%? What will it take to get to 10% without it feeling like you’re chucking a bunch of vulnerabilities over the fence?
The first thing to do in this scenario is to *gasp* actually talk to your system owners to understand their priorities, goals, and limitations. Ideally you can both agree on a target to fix X number of vulnerabilities in Y amount of time, and come to an operational level agreement. Once that’s decided, you should be able to go to your vulnerability data and see what threshold(s) would equate to this disclosure frequency.
Of course, EPSS isn’t the whole picture. Make sure to take into account additional business context when choosing which CVEs to address, something both CVSS-BTE and SSVC excel at when enriched. The lift to enrich CVSS with environmental factors (the E in BTE) is non-trivial, which makes incorporating EPSS into the threat factor (the T in BTE) a much easier lift.
Decide For Yourself
The thresholds analyzed here are not the silver bullet you’ve been looking for, because silver bullets don’t exist. What you should take away from these proposals is that a significant amount of data analysis is involved to a) produce the model, and b) operationalize it.
In addition, EPSS data is sourced from intrusion detection systems. This means that it in theory is heavily weighted towards network vulnerabilities, rather than application vulnerabilities. You can see this being played out in Patrick Garrity’s data visualization below, which compares average EPSS scores for CISA KEV entries, CVEs in Metasploit, and CVEs in Nuclei.
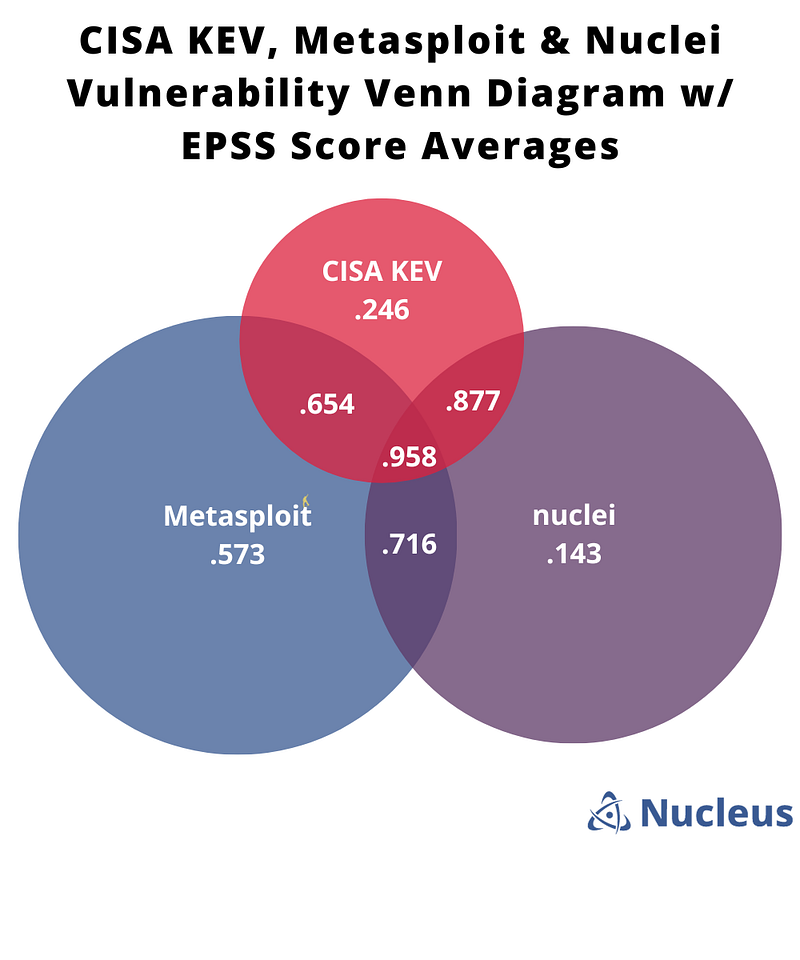
While I’ve covered a couple ways to look at using EPSS to prioritize, these views are my own, and wouldn’t necessarily apply to every environment. EPSS thresholds aren’t necessarily useful in the FAIR model or other cyber risk quantification methods because of how risk is calculated and presented monetarily. We’d be looking at the entire spectrum of scores in those contexts.
Wrapping up
I want to throw in the caveat that the prioritization thresholds discussed here are just that — prioritization thresholds. I don’t think it’s a good idea to just ignore everything under those thresholds, as there will always be a non-zero chance of exploitation. It's important to balance your vulnerability resolution approach to include a multitude of contexts (which is something that SSVC is pretty good at in my opinion).
EPSS is a valuable addition to any vulnerability management program at any maturity level. If you are using CVSS base scores alone, or even context-based prioritization but not considering the exploitation status of a vulnerability, incorporating EPSS with other forms of vulnerability/exploitation intelligence is your next step.
EPSS is most useful in conjunction with both open source and commercial vulnerability intelligence because it can serve as an early warning signal for CVE exploitation, and fill in any potential intelligence gaps your organization may have. In addition, it’s imperative to always use intelligence of known activity of exploitation over prediction where possible. Don’t get too caught up in EPSS as a primary prioritization tool.
Following the trend of EPSS v1-v3, I hope EPSS v4 aims to have an even higher F1 performance score, and will hopefully include more partners contributing exploitation data. It’s probably a good idea for the industry to start taking this model seriously.
Have more questions about EPSS ? Check out the FAQ here, or join the EPSS Special Interest Group (SIG) to engage directly with the chairs and other vulnerability management enthusiasts.
The views presented in this blog are entirely my own and do not represent the views of any organization or other affiliation.
PS, if you want to see a cool visualization of machine learning in action, take a look at this video.